Comments
MongoQP: MongoDB Slow Query Profiler
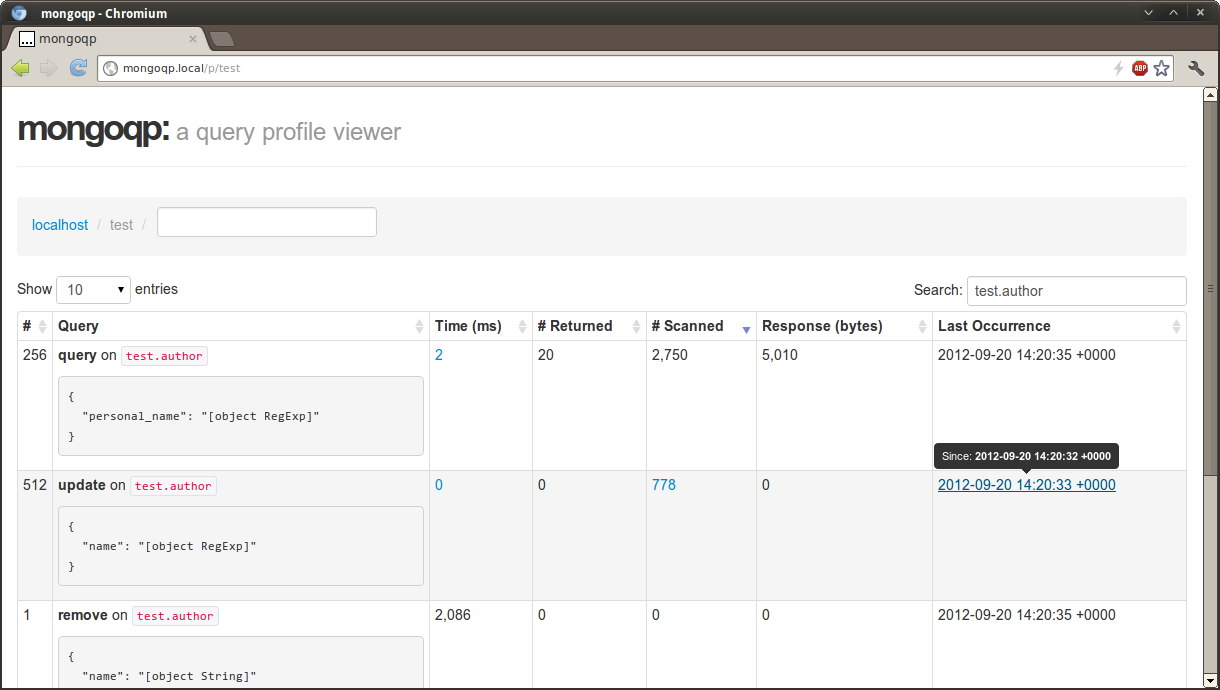
Logging slow queries is essential for any database application, and MongoDB makes doing so relatively painless with its database profiler. Unfortunately, making sense of the system.profile collection and tying its contents back to your application requires a bit more effort. The heart of mongoqp (MongoDB Query Profiler) is a bit of map/reduce JavaScript that aggregates those queries by their BSON skeleton (i.e. keys preserved, but values removed). With queries reduced to their bare structure, any of their statistics can be aggregated, such as average query time, index scans, counts, etc.
As a fan of Justin Hileman’s Genghis, a single-file MongoDB admin app, I originally intended to contribute a new UI with the profiler results, but one night was not enough time to wrap my head around Backbone.js and develop the query aggregation. Instead, I whipped up a quick frontend using the Silex PHP micro-framework. But with the hack day deadline no longer looming, there should be plenty of time to get this functionality ported over to Genghis. Additionally, the map/reduce JS may also show up in Tyler Brock’s mongo-hacker shell enhancement package.
While presenting mongoqp to my co-workers, I also learned about Dan Crosta’s professor, which already provides many of the features I had hoped to implement, such as incremental data collection. I think there is still a benefit to developing the JS innards of mongoqp and getting its functionality ported over to other projects, but I would definitely encourage you to check out professor if you’d like a stand-alone query profile viewer.
As for MongoQP, contributions are welcome through Github.